
Centos 7.4系统Filebeat + Kafka + ELK 日志收集系统
ELK目前主流的一种日志系统,过多的就不多介绍了
Filebeat收集日志,将收集的日志输出到kafka,避免网络问题丢失信息
kafka接收到日志消息后直接消费到Logstash
Logstash将从kafka中的日志发往elasticsearch
Kibana对elasticsearch中的日志数据进行展示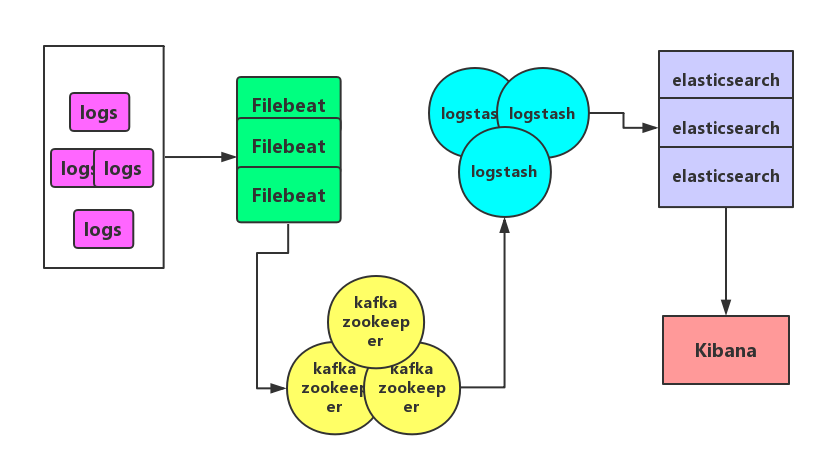
环境介绍:
软件版本:
- Centos 7.4
- java 1.8.0_45
- Elasticsearch 6.4.0
- Logstash 6.4.0
- Filebeat 6.4.0
- Kibana 6.4.0
- Kafka 2.12
- Zookeeper 3.4.13
服务器:
- 10.241.0.1 squid(软件分发,集中控制)
- 10.241.0.10 node1
- 10.241.0.11 node2
- 10.241.0.12 node3
部署角色
- elasticsearch: 10.241.0.10(master),10.241.0.11,10.241.0.12
https://www.elastic.co/cn/products/elasticsearch
Elasticsearch 允许执行和合并多种类型的搜索 ( 结构化、非结构化、地理位置、度量指标 )搜索方式
- logstash: 10.241.0.10,10.241.0.11,10.241.0.12
https://www.elastic.co/cn/products/logstash
Logstash 支持各种输入选择 ,可以在同一时间从众多常用来源捕捉事件
- filebeat: 10.241.0.10,10.241.0.11,10.241.0.12
https://www.elastic.co/cn/products/beats/filebeat
Filebeat 内置的多种模块(auditd、Apache、NGINX、System 和 MySQL)可实现对常见日志格式的一键收集、解析和可视化.
- kibana: 10.241.0.10
https://www.elastic.co/cn/products/kibana
Kibana 让您能够可视化 Elasticsearch 中的数据并操作 Elastic Stack
- kafka: 10.241.0.10,10.241.0.11,10.241.0.12
http://kafka.apache.org/
Kafka是一种高吞吐量的分布式发布订阅消息系统,它可以处理消费者规模的网站中的所有动作流数据
开始安装部署ELK
1.下载安装包及测试安装包完整性
[root@squid ~]# cat /etc/hosts
10.241.0.1 squid
10.241.0.10 squid
10.241.0.11 node2
10.241.0.12 node3
[root@squid ~]# wget https://artifacts.elastic.co/downloads/elasticsearch/elasticsearch-6.4.0.tar.gz
[root@squid ~]# wget https://artifacts.elastic.co/downloads/elasticsearch/elasticsearch-6.4.0.tar.gz.sha512
[root@squid ~]# wget https://artifacts.elastic.co/downloads/kibana/kibana-6.4.0-linux-x86_64.tar.gz
[root@squid ~]# wget https://artifacts.elastic.co/downloads/kibana/kibana-6.4.0-linux-x86_64.tar.gz.sha512
[root@squid ~]# wget https://artifacts.elastic.co/downloads/logstash/logstash-6.4.0.tar.gz
[root@squid ~]# wget https://artifacts.elastic.co/downloads/logstash/logstash-6.4.0.tar.gz.sha512
[root@squid ~]# wget https://artifacts.elastic.co/downloads/beats/filebeat/filebeat-6.4.0-linux-x86_64.tar.gz
[root@squid ~]# wget https://artifacts.elastic.co/downloads/beats/filebeat/filebeat-6.4.0-linux-x86_64.tar.gz.sha512
[root@squid ~]# yum install perl-Digest-SHA
[root@squid ~]# shasum -a 512 -c elasticsearch-6.4.0.tar.gz.sha512
elasticsearch-6.4.0.tar.gz: OK
[root@squid ~]# shasum -a 512 -c filebeat-6.4.0-linux-x86_64.tar.gz.sha512
filebeat-6.4.0-linux-x86_64.tar.gz: OK
[root@squid ~]# shasum -a 512 -c kibana-6.4.0-linux-x86_64.tar.gz.sha512
kibana-6.4.0-linux-x86_64.tar.gz: OK
[root@squid ~]# shasum -a 512 -c logstash-6.4.0.tar.gz.sha512
logstash-6.4.0.tar.gz: OK
2.部署elasticsearch
1) Ansible主机清单
[root@squid ~]# cat /etc/ansible/hosts
[client]
10.241.0.10 es_master=true
10.241.0.11 es_master=false
10.241.0.12 es_master=false
2) 创建es用户和用户组
[root@squid ~]# ansible client -m group -a 'name=elk'
[root@squid ~]# ansible client -m user -a 'name=es group=elk home=/home/es shell=/bin/bash'
3) 将elasticsearch解压到目标主机
[root@squid ~]# ansible client -m unarchive -a 'src=/root/elasticsearch-6.4.0.tar.gz dest=/usr/local owner=es group=elk'
4)将准备好的es配置文件模板分发到各个节点
[root@squid ~]# cat elasticsearch.yml.j2
#集群名称及数据存放位置
cluster.name: my_es_cluster
node.name: es-{{ansible_hostname}}
path.data: /data/elk/es/data
path.logs: /data/elk/es/logs
#允许跨域访问
http.cors.enabled: true
http.cors.allow-origin: "*"
#集群中的角色
node.master: {{es_master}}
node.data: true
#允许访问的地址及传输使用的端口
network.host: 0.0.0.0
transport.tcp.port: 9300
#使用tcp传输压缩
transport.tcp.compress: true
http.port: 9200
#使用单播模式去连接其他节点
discovery.zen.ping.unicast.hosts: ["node1","node2","node3"]
5) 执行ansible,分发配置文件
[root@squid ~]# ansible client -m template -a 'src=/root/elasticsearch.yml.j2 dest=/usr/local/elasticsearch-6.4.0/config/elasticsearch.yml owner=es group=elk'
6) 修改系统允许最大打开的文件句柄数等参数,
[root@squid ~]# cat change_system_args.sh
#!/bin/bash
if [ "`grep 65536 /etc/security/limits.conf`" = "" ]
then
cat >> /etc/security/limits.conf << EOF
# End of file
* - nofile 1800000
* soft nproc 65536
* hard nproc 65536
* soft nofile 65536
* hard nofile 65536
EOF
fi
if [ "`grep 655360 /etc/sysctl.conf`" = "" ]
then
echo "vm.max_map_count=655360" >> /etc/sysctl.conf
fi
7) 通过ansible来执行脚本
[root@squid ~]# ansible client -m script -a '/root/change_system_args.sh'
8) 重启目标主机,是参数生效(因为目标主机重启 所以ansible连不上)
[root@squid ~]# ansible client -m shell -a 'reboot'
10.241.0.11 | UNREACHABLE! => {
"changed": false,
"msg": "SSH Error: data could not be sent to remote host \"10.241.0.11\". Make sure this host can be reached over ssh",
"unreachable": true
}
10.241.0.12 | UNREACHABLE! => {
"changed": false,
"msg": "SSH Error: data could not be sent to remote host \"10.241.0.12\". Make sure this host can be reached over ssh",
"unreachable": true
}
10.241.0.10 | UNREACHABLE! => {
"changed": false,
"msg": "SSH Error: data could not be sent to remote host \"10.241.0.10\". Make sure this host can be reached over ssh",
"unreachable": true
}
9 )创建elk目录
[root@squid ~]# ansible client -m file -a 'name=/data/elk/ state=directory owner=es group=elk'
10) 启动es
[root@squid ~]# ansible client -m shell -a 'su - es -c "/usr/local/elasticsearch-6.4.0/bin/elasticsearch -d"'
10.241.0.11 | SUCCESS | rc=0 >>
10.241.0.10 | SUCCESS | rc=0 >>
10.241.0.12 | SUCCESS | rc=0 >>
11) 查看是否启动
[root@squid ~]# ansible client -m shell -a 'ps -ef|grep elasticsearch'
12) 查看集群状态
[root@squid ~]# curl -s http://node1:9200/_nodes/process?pretty |grep -C 5 _nodes
{
"_nodes" : {
"total" : 3,
"successful" : 3,
"failed" : 0
},
"cluster_name" : "my_es_cluster",
3.部署Filebeat
1) 分发安装包到客户机
[root@squid ~]# ansible client -m unarchive -a 'src=/root/filebeat-6.4.0-linux-x86_64.tar.gz dest=/usr/local'
2) 修改安装包名称
[root@squid ~]# ansible client -m shell -a 'mv /usr/local/filebeat-6.4.0-linux-x86_64 /usr/local/filebeat-6.4.0'
10.241.0.12 | SUCCESS | rc=0 >>
10.241.0.11 | SUCCESS | rc=0 >>
10.241.0.10 | SUCCESS | rc=0 >>
3) 修改配置文件
[root@squid ~]# cat filebeat.yml.j2
filebeat.prospectors:
- type: log
paths:
- /var/log/supervisor/kafka
output.kafka:
enabled: true
hosts: ["10.241.0.10:9092","10.241.0.11:9092","10.241.0.12:9092"]
topic: kafka_run_log
##参数解释
enabled 表明这个模块是启动的
host 把filebeat的数据发送到那台kafka上
topic 这个很重要,发送给kafka的topic,若topic不存在,则会自动创建此topic
4) 分发到客户机,并将原来的配置文件备份
[root@squid ~]# ansible client -m copy -a 'src=/root/filebeat.yml.j2 dest=/usr/local/filebeat-6.4.0/filebeat.yml backup=yes'
5) 启动filebeat
[root@squid ~]# ansible client -m shell -a '/usr/local/filebeat-6.4.0/filebeat -c /usr/local/filebeat-6.4.0/filebeat.yml &'
10.241.0.11 | SUCCESS | rc=0 >>
10.241.0.10 | SUCCESS | rc=0 >>
10.241.0.12 | SUCCESS | rc=0 >>
6) 查看filebeat进程
[root@squid ~]# ansible client -m shell -a 'ps -ef|grep filebeat| grep -v grep'
10.241.0.12 | SUCCESS | rc=0 >>
root 4890 1 0 22:50 ? 00:00:00 /usr/local/filebeat-6.4.0/filebeat -c /usr/local/filebeat-6.4.0/filebeat.yml
10.241.0.10 | SUCCESS | rc=0 >>
root 6881 1 0 22:50 ? 00:00:00 /usr/local/filebeat-6.4.0/filebeat -c /usr/local/filebeat-6.4.0/filebeat.yml
10.241.0.11 | SUCCESS | rc=0 >>
root 4939 1 0 22:50 ? 00:00:00 /usr/local/filebeat-6.4.0/filebeat -c /usr/local/filebeat-6.4.0/filebeat.yml
7) 查看是否有topic创建成功
[root@node1 local]# /usr/local/kafka/bin/kafka-topics.sh --list --zookeeper 10.241.0.10:2181
ConsumerTest
__consumer_offsets
kafka_run_log #filebeat创建的topic
topicTest
4.部署Logstash
1) 解压安装包值目标主机
[root@squid ~]# ansible client -m unarchive -a 'src=/root/logstash-6.4.0.tar.gz dest=/usr/local owner=es group=elk'
2) Logstash配置文件
[root@squid ~]# cat logstash-kafka.conf.j2
input {
kafka {
type => "kafka-logs"
bootstrap_servers => "10.241.0.10:9092,10.241.0.11:9092,10.241.0.12:9092"
group_id => "logstash"
auto_offset_reset => "earliest"
topics => "kafka_run_log"
consumer_threads => 5
decorate_events => true
}
}
output {
elasticsearch {
index => 'kafka-run-log-%{+YYYY.MM.dd}'
hosts => ["10.241.0.10:9200","10.241.0.11:9200","10.241.0.12:9200"]
}
3) 使用ansible推送logstash配置文件到目标主机
[root@squid ~]# ansible client -m copy -a 'src=/root/logstash.conf.j2 dest=/usr/local/logstash-6.4.0/config/logstash.conf owner=es group=elk'
4) 启动Logstash
[root@squid ~]# ansible client -m shell -a 'su - es -c "/usr/local/logstash-6.4.0/bin/logstash -f /usr/local/logstash-6.4.0/config/logstash.conf &"'
5)_查看Logstash进程
[root@squid ~]# ansible client -m shell -a 'ps -ef|grep logstash|grep -v grep'
5.部署kibana
1) 将安装包拷贝到node1节点
[root@squid ~]# scp kibana-6.4.0-linux-x86_64.tar.gz root@10.241.0.10:/root
kibana-6.4.0-linux-x86_64.tar.gz 100% 179MB 59.7MB/s 00:03
2) 解压kibana
[root@node1 ~]# tar -zxf kibana-6.4.0-linux-x86_64.tar.gz -C /usr/local
[root@node1 ~]# mv /usr/local/kibana-6.4.0-linux-x86_64/ /usr/local/kibana-6.4.0
3) 修改配置文件
[root@node1 ~]# cat /usr/local/kibana-6.4.0/config/kibana.yml
server.port: 5601
server.host: "10.241.0.10"
kibana.index: ".kibana
4) 启动kibana (前台启动)
[root@node1 ~]# /usr/local/kibana-6.4.0/bin/kibana
5) 访问的kibana
http://10.241.0.10:5601
6) 添加日志
Management -> Kibana 列Index Patterns -> Index pattern
7) 发送消息到kafka-run-log topic,查看是否能通过kibana展示


本文由 帝一博客 原创发布。用户在本站发布的原创内容(包括但不仅限于回答、文章和评论),著作权均归用户本人所有。独家文章转载,请联系邮箱:17762131@qq.com。获得授权后,须注明本文地址: https://bubukou.com/linuxyunwei/1921.html
-

一个小时学会搭建和使用 kubernetes
2021-12-07 17:36
-

linux生成公钥私钥ssh远程实现直接免密登录
2021-05-11 10:31
-

linux(centos)安装lrzsz上传下载软件rz,s...
2021-01-25 17:58
-

linux mkfs.ext4命令格式化硬盘
2021-01-15 14:54
-

查看linux系统增加根目录空间不足
2020-12-31 11:28
-

linux下如何tightvncserver安装使用图形化访...
2020-12-28 19:03
-

centos7中 yum跟python的安装【附带pytho...
2020-12-08 20:57
-

Centos 7.4系统Filebeat + Kafka +...
2020-12-07 10:45
-

CentOS 7系统搭建Rsyslog+LogAnalyze...
2020-12-03 22:12
-

linux groups命令显示指定用户帐户的组群成员身份
2020-11-29 15:52
网友留言评论